The Randomness of Pulse Shapes

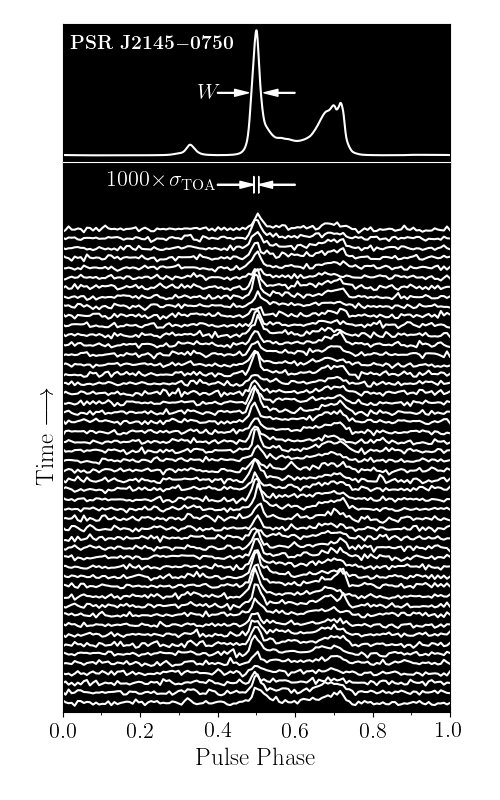
Image: Jitter in the NANOGrav pulsar J2145-0750. Each pulse is actually made of 10 individual pulses for clarity, but one can see that even these averages "jitter" around compared to the very stable average pulse at top. Reproduced from "Science with the Next-Generation VLA and Pulsar Timing Arrays"

  • The "miracle" of pulsar timing relies on the fact that the average pulse shape of pulsars is very stable. Over the course of decades, we can therefore determine when a set of pulses arrives at our telescopes very precisely.
  • Since their discovery, it has been known that individual pulses from pulsars do not resemble their average pulse shape. that means that while the climate of the pulsar magnetosphere is extremely stable, there is signicant weather on the timescale of a single rotation.
  • Calculating a time of arrival (TOA) relies on fitting a template pulse shape to a data pulse shape. This assumption relies on the fact that the data shape is an exact copy of the template shape, scaled and shifted. Since the average data shape is actually made of individual pulses all of different shapes, the assumption of "matched filtering" is broken and we must account for this effect in estimating our TOA uncertainties.
  • Advancing the characterization and modeling of sources of noise in our timing data is a prime focus of NANOGrav's Noise Budget working group.

The NANOGrav 12.5-year Data Set

  • NANOGrav's upcoming data release contains radio-pulse times of arrival (TOAs) and timing-models for 48 millisecond pulsars. At the time of the submission of this paper, the pulse profiles however were finalized.
  • The observations span roughly 12.9 years, from July 30, 2005, to June 30, 2017. The pulsar with the longest baseline is J1744-1134, with 12.87 years of observations. The pulsar with the largest data volume is J1713+0747, with 40,000 TOAs.
  • Observations were carried out using the 100-m Robert C. Byrd Green Bank Telescope (GBT) of the Green Bank Observatory, and the 305-m William E. Gordon Telescope (Arecibo) of Arecibo Observatory.
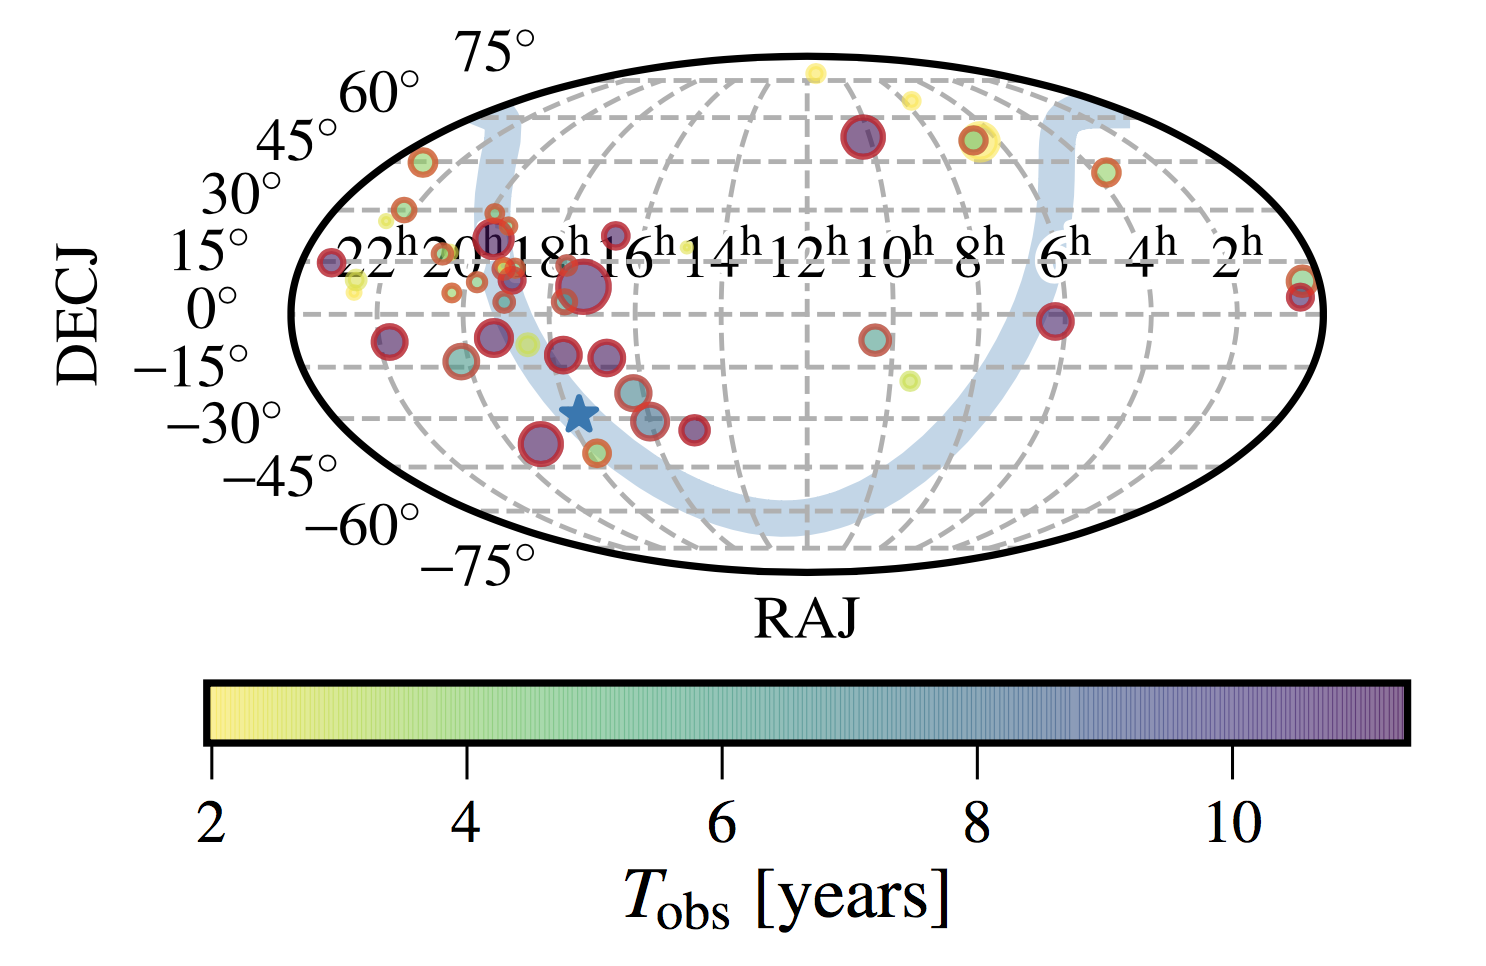
  • In the sky map shown here for the 11-year data set, pulsar positions are marked by circles, with areas proportional to the number of TOAs in the dataset; the color scale indicates the timing baseline. The 12.5-year data set adds three additional pulsars. The 34 pulsars with baselines greater than 3 years have solid red edges. We use only these 34 in our searches for a GW background.

Image: sky map of NANOGrav pulsars in the 11-yr data set.

Short-Term Timing Residuals

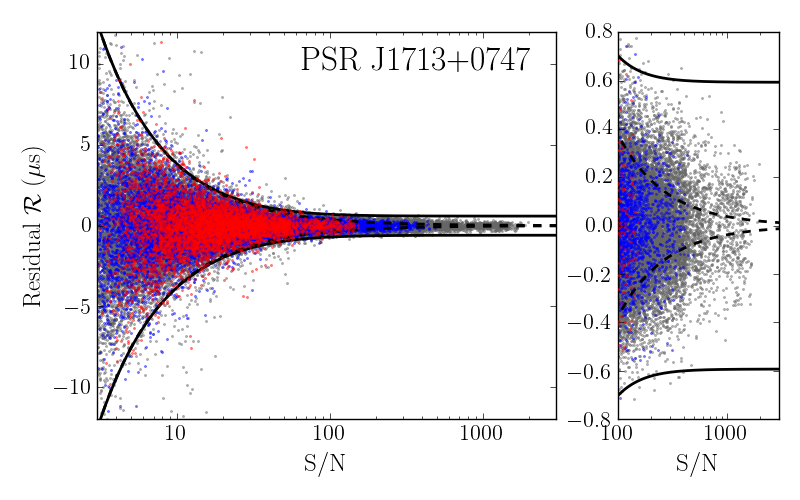
Image: Short-term timing residuals as a function of pulse signal-to-noise (S/N) ratio for one of our best pulsars, PSR J1713+0747, over three frequency bands (red: 820 MHz, gray: 1400 MHz, blue: 2300 MHz). Without jitter, as the S/N gets very large, we expect the spread in the points to go to zero. We see that this is not the case and that there is a constant spread out to high S/N.

  • Rather than examine the TOAs produced in our final data set, we return to the calibrated data profiles with finer time resolution, typically broken into 1 or 2 minute integrations, allowing us to probe jitter in short timescales. We perform our analysis with the NANOGrav software package PyPulse.
  • For each individual observation in our data set, we assume that the "initial" timing model is not perfect but fairly good. We fit for a modification to the timing model and subtract all frequency-dependent delays over the course of each observation to remove unknown dispersion, profile evolution, and more. We are left over with short-term timing residuals.
  • Once we have our set of short-term timing residuals, we plot them as a function of pulse signal-to-noise (S/N) ratio. If there was no jitter, we would expect that as the S/N goes to infinity, that the spread of the residuals would go to zero. Instead we see that as the S/N gets larger, the spread remains constant, due to the random nature of jitter.
  • We must also account for a separate effect due to the interstellar medium, which causes slight pulse shape changes as well. We can predict what the amplitude of scintillation noise from scattering measurements, such as in the analysis on our 9-year data set.

Modeling the Frequency Dependence

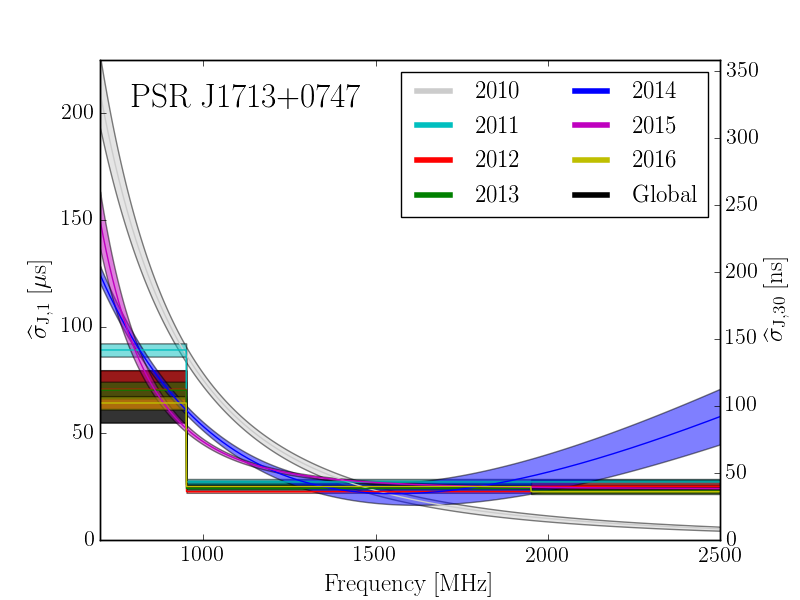
  • We compared five different models for the functional form of the frequency dependence of jitter: constant with frequency, constant within each frequency band, power law, power law plus a constant, and a log polynomial
  • We used maximum likelihood methods in our analysis to estimate the parameters of our different models. Our code was written on top of the EMCEE Markov chain Monte Carlo package.
  • For 43 of the 48 pulsars examined, we were able to detect significant jitter, compared with 22 out of 37 in our previous analysis on the 9-yr data set. We found significant frequency dependence in 30 pulsars in our data set.
  • We compared which model was most preferred using the Bayesian Information Criterion. The most significant model for jitter was the power-law dependence.

Image: The most preferred models for jitter for PSR J1713+0747 when looking at each year indepedently.

The Statistics of Jitter

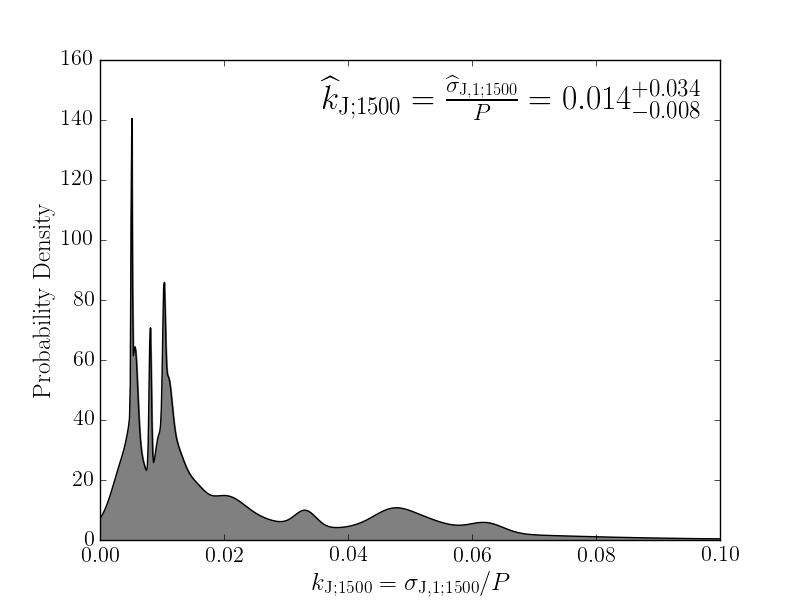
Image: The probability density function for the jitter parameter we use, which describes the amplitude of the jitter at the single single pulse level divided by the pulse period.

  • While the amplitude of jitter varies per pulsar, we found that the rule of thumb for the amplitude is that the timing variations from jitter are roughly 1% of a pulsar's period.
  • Jitter was seen to correlate with the the average pulse width as well as the number of components that make up a pulse shape. Because pulse shapes are complex, our method simplifies the timing variations to a single number for each pulsar at each frequency.
  • For the bright millisecond pulsar B1937+21, we were able to test the statistics of jitter between its main pulse with its interpulse. We found that the values were largely consistent.
  • We we do not expect there to be time dependence to jitter, we investigate this possibility in two of our best pulsars. We see that some slight variations in the pulsar J1909-3744 are likely due to radio frequency interference and that, if so, the intrinsic value of jitter may be lower, and the pulsar may be even more precise than we can currently measure.

Future Prospects for Noise Modeling

  • As new, larger telescopes come online, it is important to take jitter into account as the dominant source of TOA uncertainty over noise in the electronics. Building a larger telescope or a receiver that covers wider frequency does not reduce the jitter noise. The only way to reduce jitter is by observing a pulsar for more time. Breaking arrays of telescopes into "sub-arrays" may also be useful in certain cases.
  • Since jitter is becoming so dominant, it is an important factor to consider in the design of new telescopes. As NANOGrav looks to develop new concepts for a dedicated pulsar timing array telescope, numbers like these feature heavily in those calculations.
  • For telescopes currently observing in the worldwide International Pulsar Timing Array effort, we may decide that certain telescopes should observe pulsars which are heavily dominated by the effect of jitter, while other more sensitive telescopes should focus on weker pulsars. These analyses, however, must be understood in greater depth.
  • As with the Laser Interferometer Gravitational-Wave Observatory (LIGO), we must understand all of our sources of noise and form our "noise budget" so that we can produce a believable detection of gravitational waves.

Image: A noise spectrum for PSR J1713+0747, summarizing a wide variety of physical effects that have been studied in NANOGrav pulsars, including jitter. Courtesy J. Cordes.

Authors

  • Members of the NANOGrav Collaboration: M. T. Lam, M. A. McLaughlin, Z. Arzoumanian, H. Blumer, P. R. Brook, H. T. Cromartie, P. B. Demorest, M. E. DeCesar, T. Dolch, J. A. Ellis, R. D. Ferdman, E. C. Ferrara, E. Fonseca, N. Garver-Daniels, P. A. Gentile, M. L. Jones, D. R. Lorimer, R. S. Lynch, C. Ng, D. J. Nice, T. T. Pennucci, S. M. Ransom, R. Spiewak, I. H. Stairs, K. Stovall, J. K. Swiggum, S. J. Vigeland, W. W. Zhu
  • Contact: Dr. Michael T. Lam (corresponding author), Dr. Scott Ransom (NANOGrav chair).

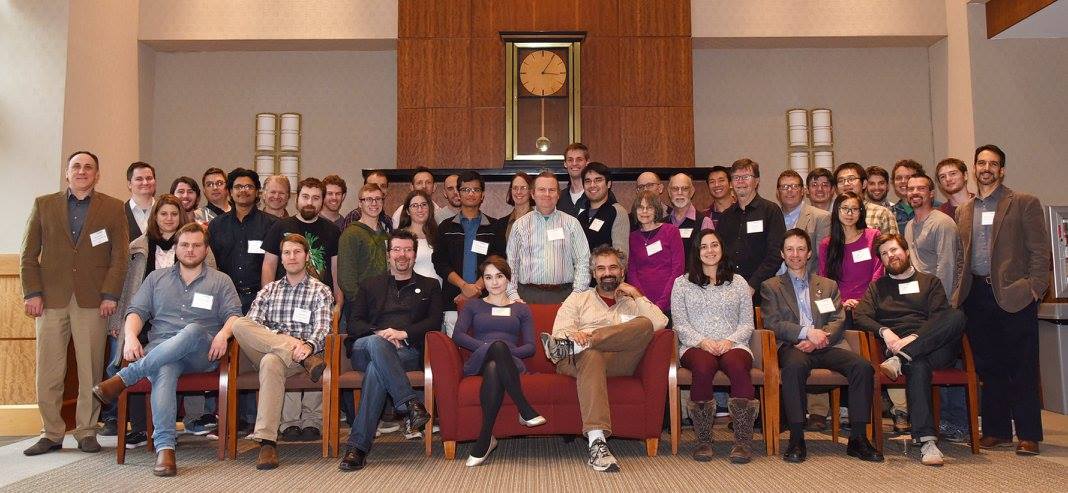
The NANOGrav Collaboration at the 2017 Fall meeting in Lafayette College, PA