A Second Chromatic Timing Event of Interstellar Origin Toward PSR J1713+0747
by the NANOGrav Collaboration; corresponding author: Michael T. Lam.
Published in The Astrophysical Journal, July 10th, 2018.
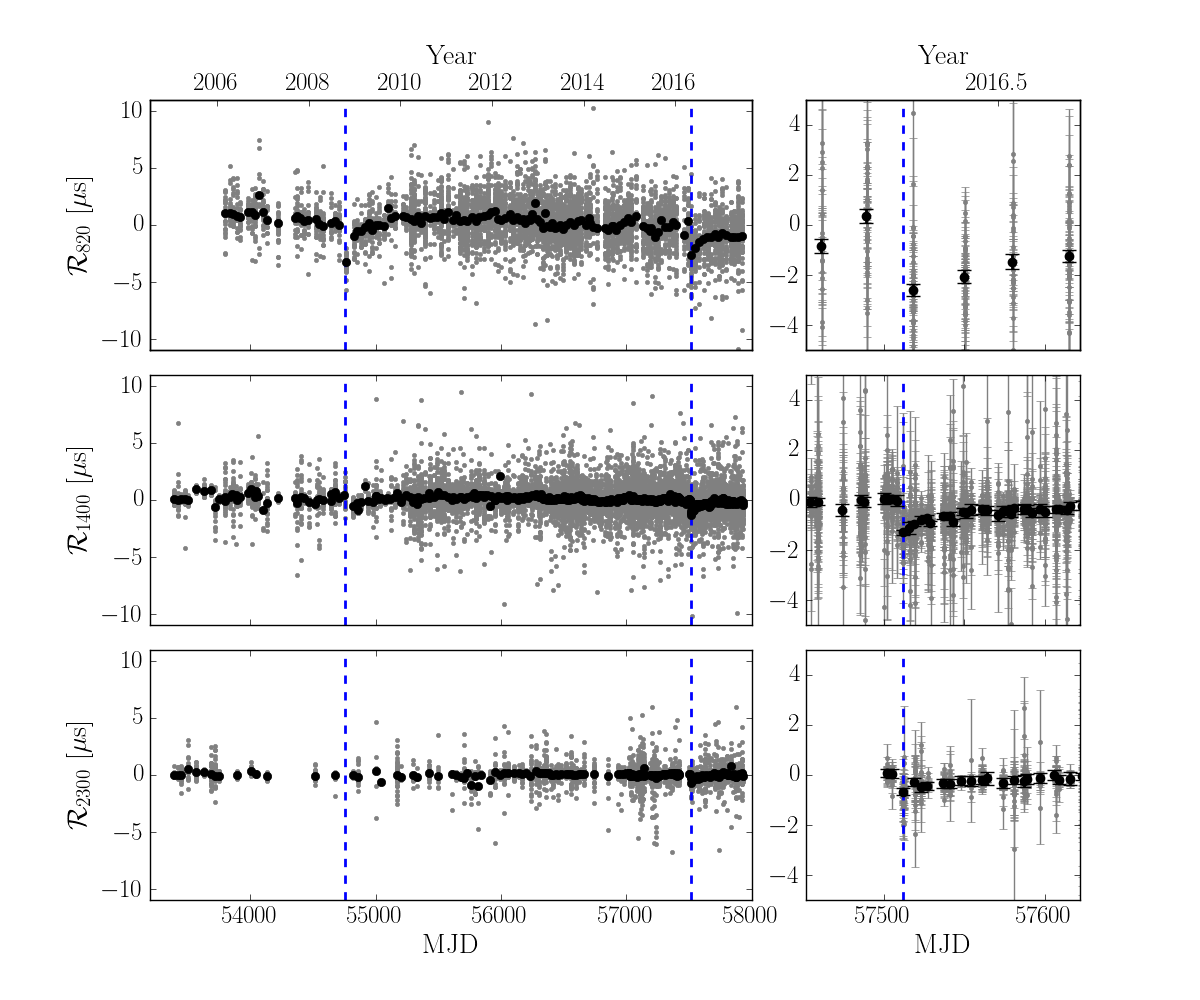
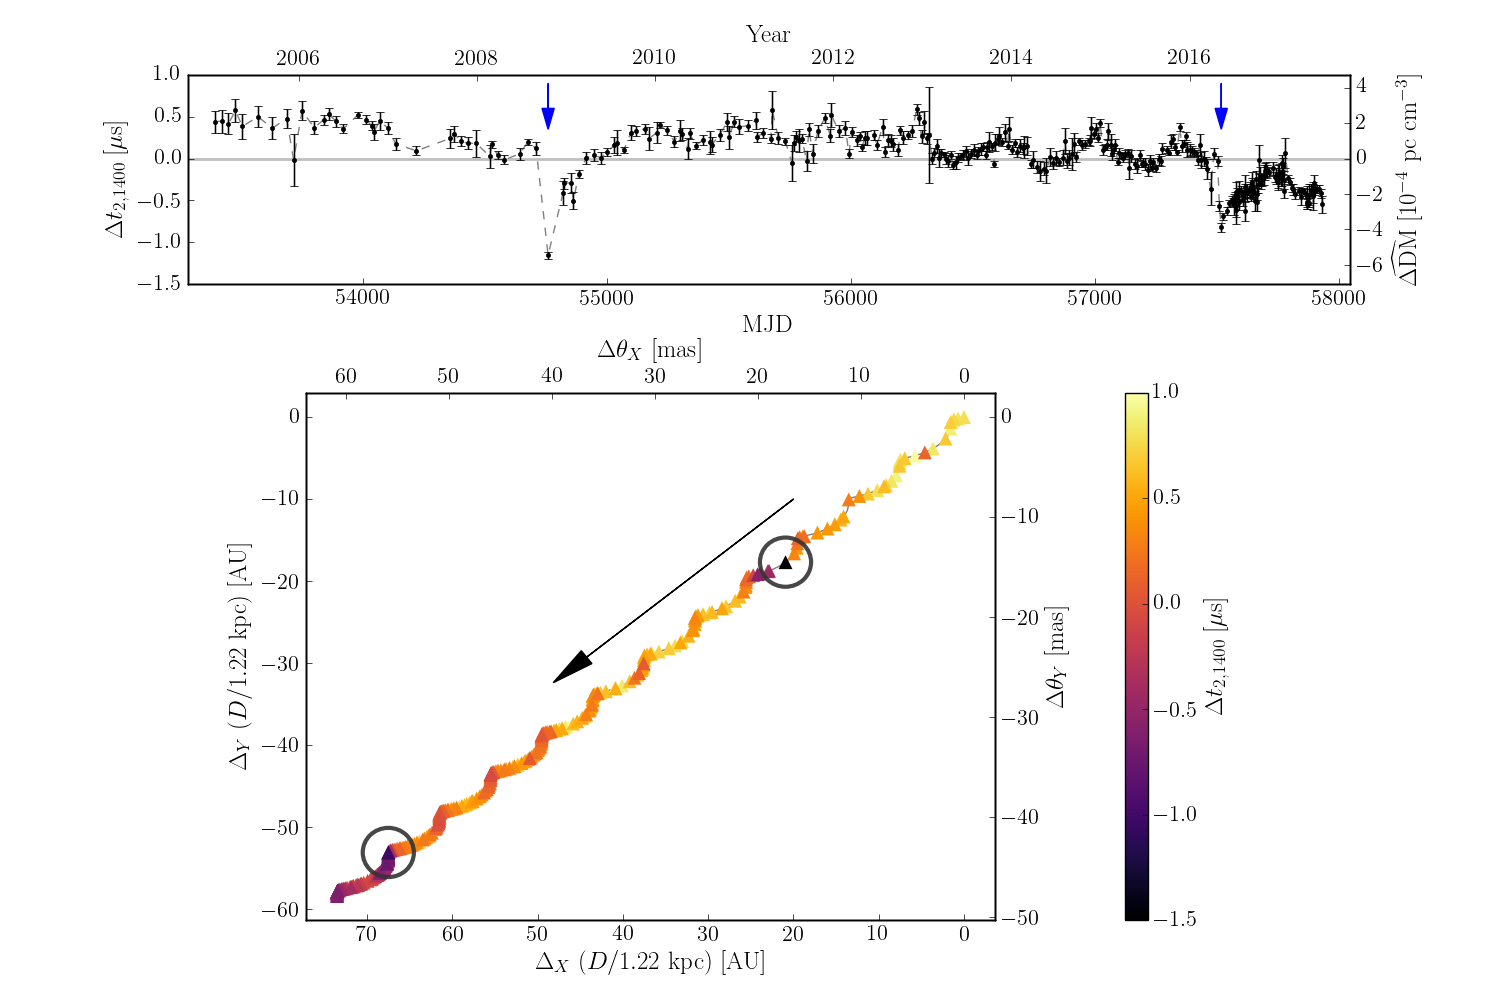
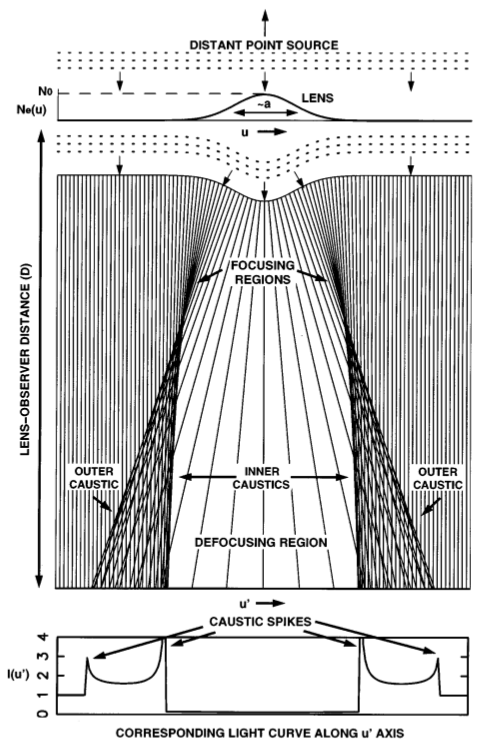
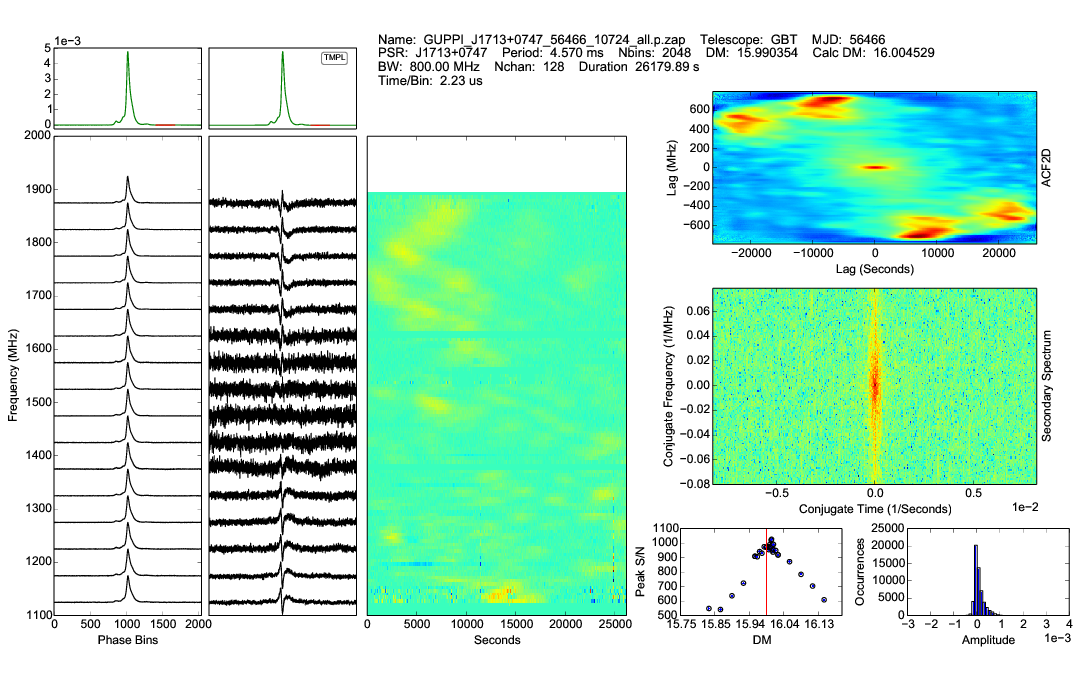
We detected a second radio-frequency-dependent timing variation in the direction of the pulsar J1713+0747 in 2016 using the preliminary 12.5-year dataset from the North American Nanohertz Observatory for Gravitational Waves (NANOGrav). The first event was seen in 2008 as a dip in the "dispersion measure", a quantity describing the total electron density along the line of sight. We find the the likeliest scenario is lensing of the propagating pulsar radio emission by some structure in the interstellar medium.